
The ARR Per CSM Metric That Gets Headcount Approved

Your CS headcount model is probably wrong. And it’s quietly costing you revenue.
The only headcount requests that get funded are those framed around revenue at risk, not workload.
The difference isn’t seniority but architecture. And it starts with one number most CS orgs have never cleanly calculated:
ARR per CSM.
Get this ratio right, and you have a finance-ready argument for every hiring decision you make. Get it wrong, or worse, never measure it, and you're bleeding revenue that won't show up on your dashboard until it's too late.
What “Right” Actually Looks Like by Segment
The default industry assumption of “$1-2M per CSM” was always a starting point, never a ceiling. The latest Gainsight benchmark data tells a sharper story:
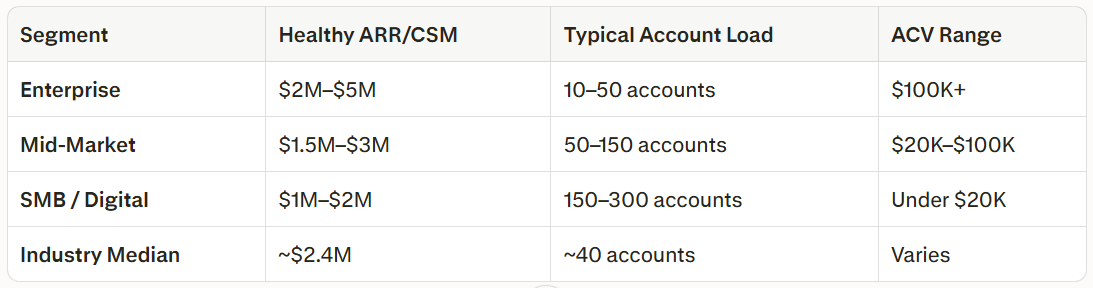
Source: Gainsight Benchmarks, 2024 (N=537 companies for ARR/CSM; N=761 for account ratios).
The trend hasn’t slowed: ARR per CSM up 20%, account loads up 50% since 2022. CSMs are covering more ground than ever.
CSMs are covering more ground than ever. The question is whether your org engineered that efficiency or accidentally created burnout and churn risk hiding in plain sight.
Three Ratio Patterns That Signal Danger
A blended number rarely tells the full story. These are the patterns worth diagnosing:
Below $1M/CSM
Over-investment without measurable retention lift. More coverage only pays off when it changes renewal outcomes, not just activity.
Above $4M/CSM without a scaled CS layer
Your team is triaging, not driving outcomes. Expansion ARR quietly stalls before churn publicly spikes.
Healthy blended number, broken segment mix
Enterprise accounts receiving mid-market attention is a logo loss on a slow fuse. The most expensive mistake you won’t see coming until renewal season.
The 10-Minute Ratio Audit
Run this before your next leadership or budget conversation.
Three pulls, ten minutes, one clear picture:
Step 1 - Blended ratio
Total managed ARR ÷ number of active CSMs
(Count only quota-carrying CSMs with an assigned book; exclude CS leaders unless they carry accounts)
Step 2 - Segment-level breakdown
Separate Enterprise, Mid-Market, and SMB. A healthy blended number routinely masks a broken Enterprise motion underneath it.
Step 3 - 12-month trend
Is your ratio rising because efficiency improved, or because ARR grew while headcount froze?
A practical operating range I use:
$1.5M-$3M => healthy, with a scaled or digital CS layer supporting the low-complexity base.
$3M-$4.5M => manageable only with strong automation, digital CS, and clear tiering.
$4.5M+ => retention risk zone. Requires immediate strategic review.
What you’ve built so far is the diagnosis.
The four tools below are the prescription and the file that runs the numbers for you automatically.
Paid subscribers get:
A CFO-grade churn exposure calculator. Fill in your ARR, walk out with a dollar figure Finance can’t dismiss
A sensitivity model that replaces one debatable number with a credible range of outcomes
Four CFO objection scripts, including the AI objection that’s killing CS headcount requests in 2026
A 30-day Revenue Visibility Sprint template: the executive commitment that makes the hire hard to reverse
+ The CS Revenue Protection Planner, a fully built Excel model (6 tabs, auto-calculating) that runs your ratio audit, generates your budget memo, and produces your board slide in under 10 minutes.
If you own $1M+ ARR, this is the fastest way to turn capacity into a budget decision.